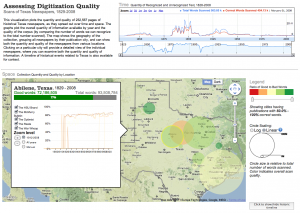
Visualization: Digitization Quality
This visualization plots the quantity and quality of 232,567 pages of historical Texas newspapers, as they spread out over time and space. The graphs plot the overall quantity of information available by year and the quality of the corpus (by comparing the number of words we can recognize to the total number scanned). The map shows the geography of the collection, grouping all newspapers by their publication city, and can show both the quantity and quality of the newspapers from various locations. Clicking on a particular city will provide a detailed view of the individual newspapers, where you can examine both the quantity and quality of information. A timeline of historical events related to Texas is also available for context.
- Mapping Texts is a collaboration between scholars, staff and students at Stanford University and the University of North Texas. It is supported by the National Endowment for the Humanities.
Project Partners
Inside
Categories
- Historical Topics (1)
- Text Mining (1)
- Uncategorized (1)
- Visualizations (2)


